Instruments
INFO
Please see the Sampling profilers and the Tracing profilers for more information.
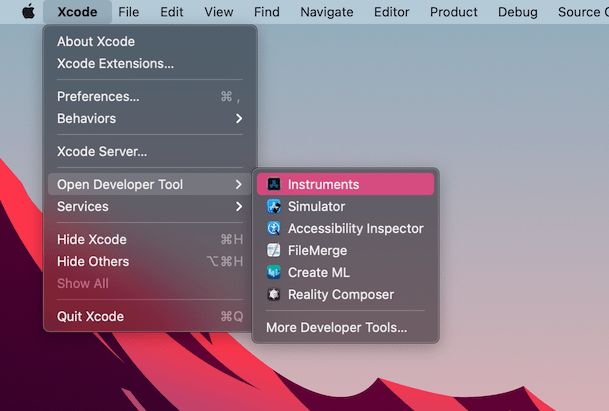
Open Xcode. Select Open Developer Tool - Instruments from the Xcode app menu:
Double-click on Time Profiler in the Instruments window:
- In the Time Profiler window, click on the Target menu, select Choose target... and specify the path to the Godot binary, command line arguments, and environment variables in the next window.
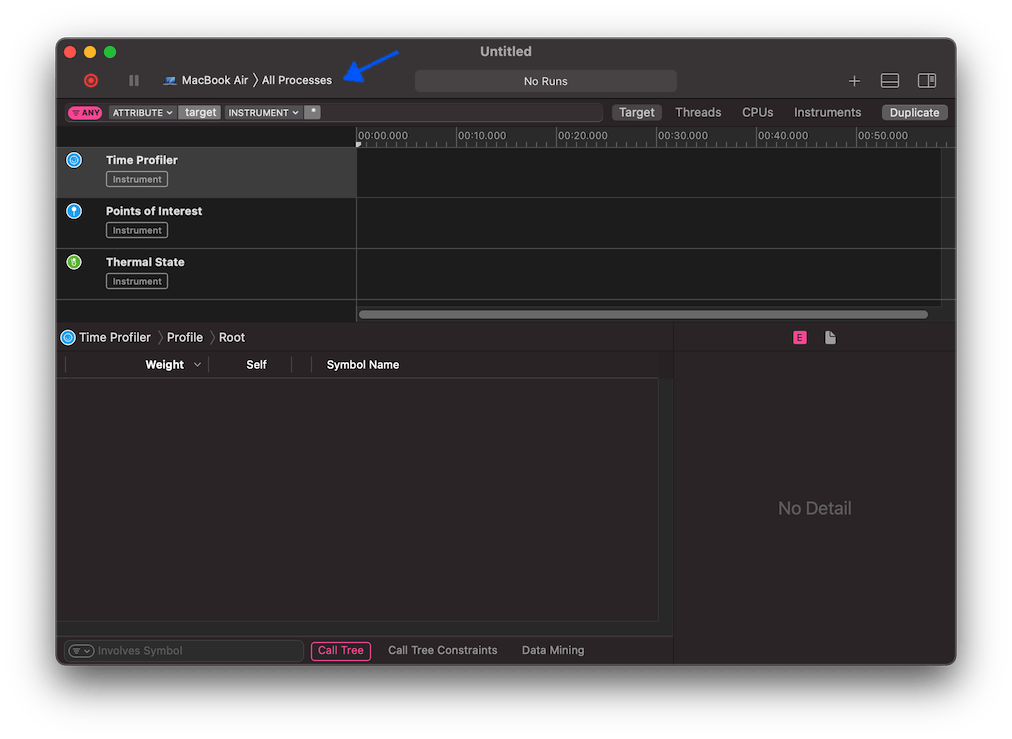
You can also attach the Time Profiler to a running process by selecting it from the Target menu.
Click the Start an immediate mode recording button to start profiling.
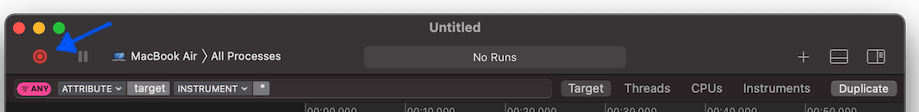
Perform the actions you wish to profile in the editor or project. When you're done, click the Stop button.
Wait for the results to appear.
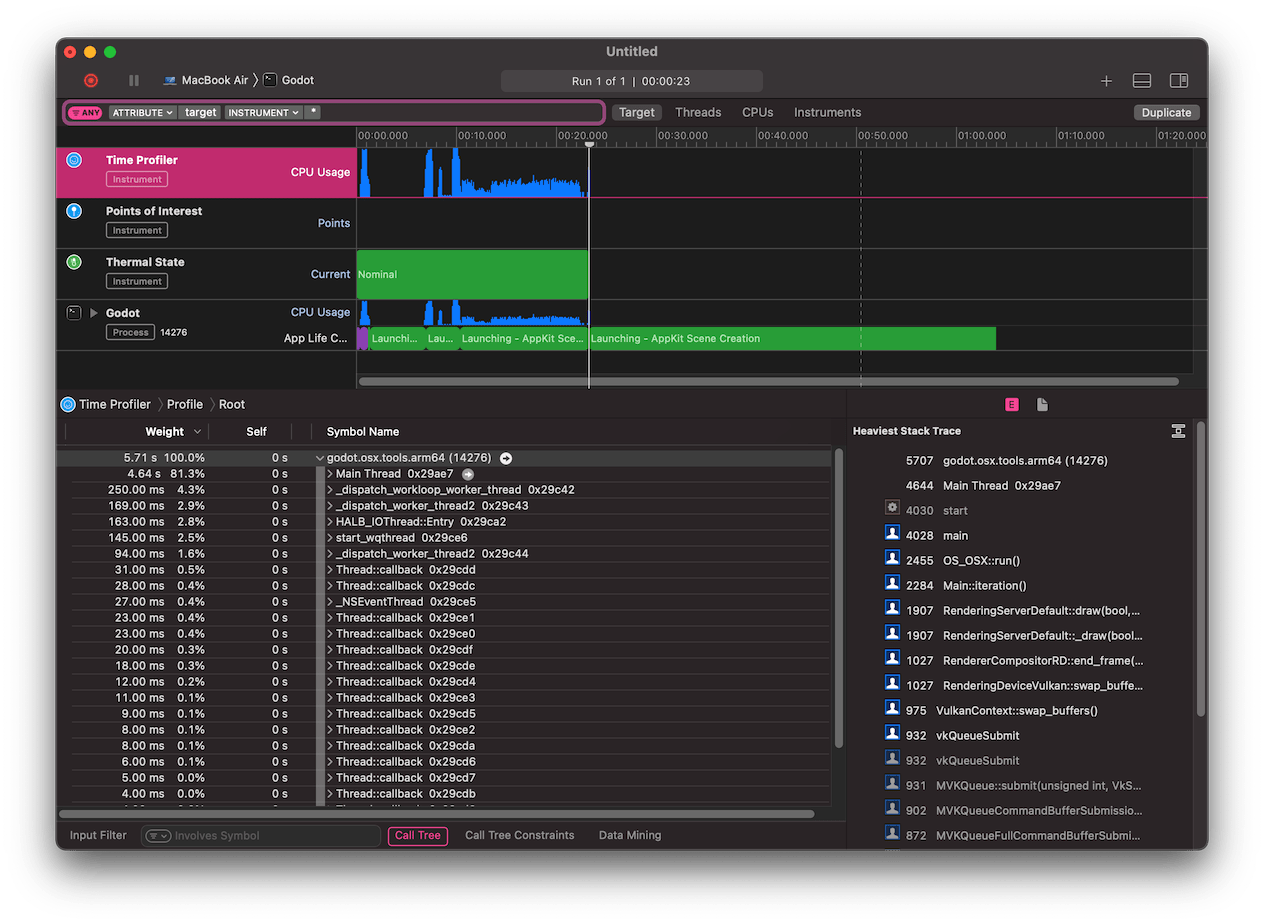
At the bottom of the window you will see a call tree for all CPU threads started, and the Heaviest Stack Trace overview.
Select Hide system libraries in the Call Tree menu (at the bottom of the window) to remove external modules.
You can use the timeline at the top of the window to display details for the specific time period.